
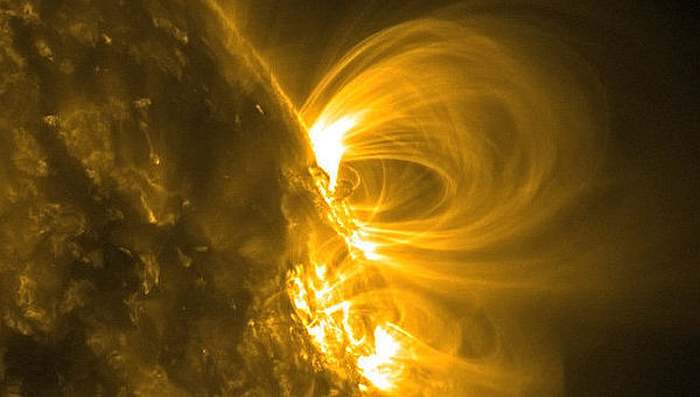
С развитием космических технологий, можно наблюдать за активностью нашей звезды уже в режиме онлайн
Здесь Вы сможете смотреть за нашей космической погодой онлайн, которая в основном зависит от активности нашей звезды. Данные поступают напрямую со спутника SDO и обновляются очень часто, поэтому Вы можете всегда узнать точное состояние активности нашего Солнца и космической погоды.
На данный момент, помимо земных инструментов, для наблюдения за нашей звездой, запущено множество космических аппаратов: SOHO, SDO, Stereo A и B. На изображениях ниже можно просматривать текущее состояние Солнца онлайн со спутника в различных диапазонах.
Фотография обновляется ежедневно. Иногда возможно отключение камер на спутнике.
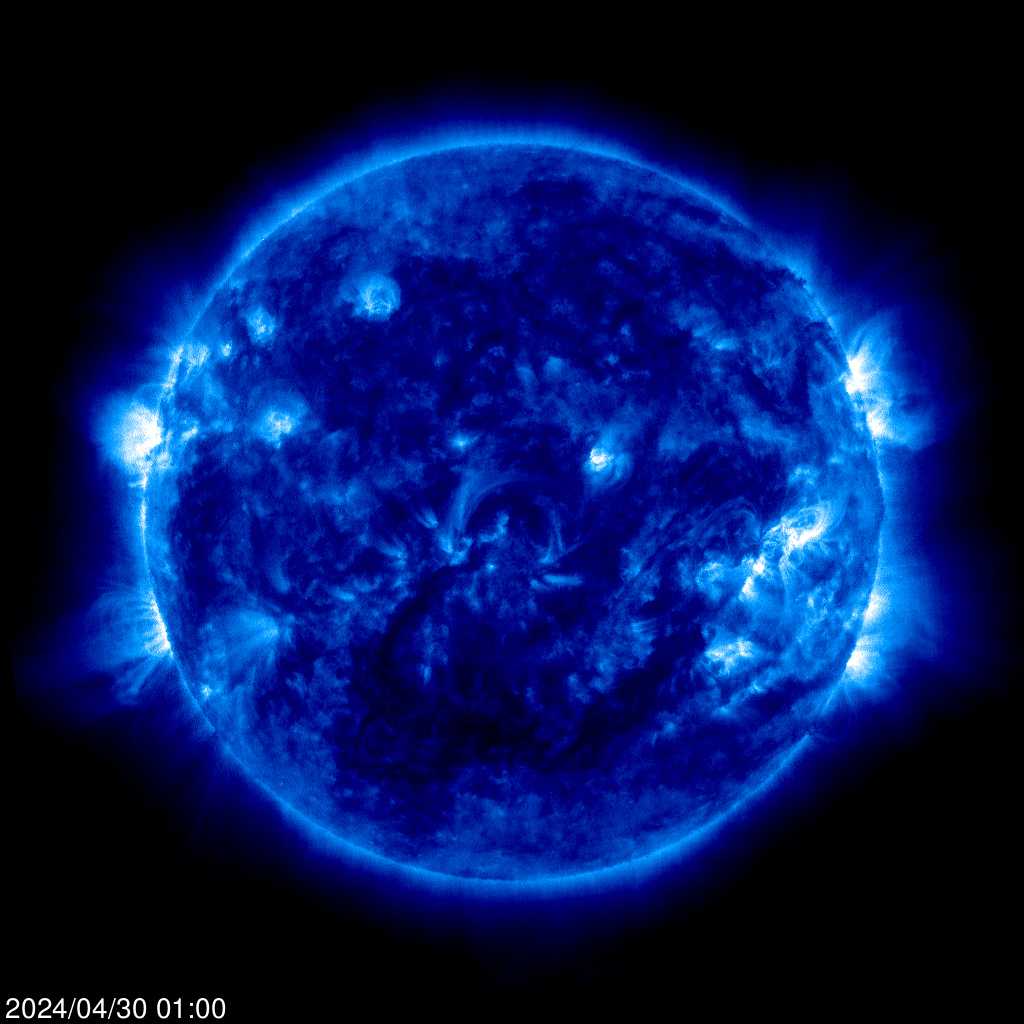
Солнце на длине волны 171 ангстрем (ультрафиолетовый диапазон), что соответствует температуре порядка 1 млн. градусов.
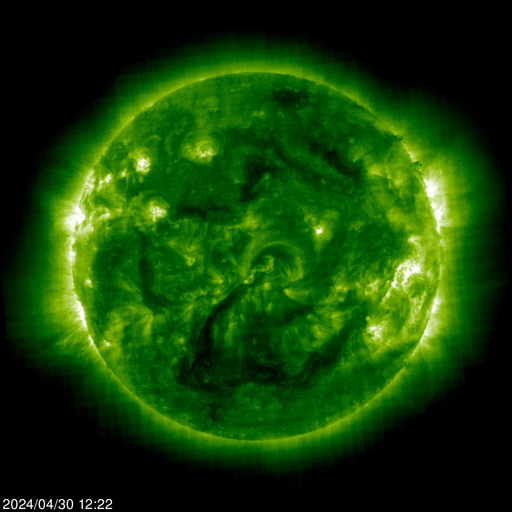
Солнце на длине волны 195 ангстрем (ультрафиолетовый диапазон), что соответствует температуре порядка 1,5 млн. градусов.
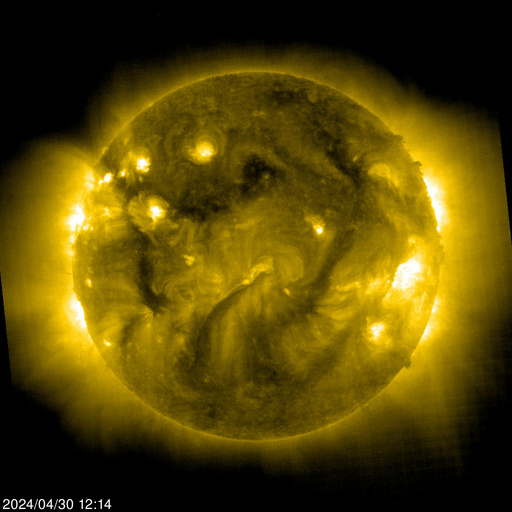
Солнце на длине волны 284 ангстрем (ультрафиолетовый диапазон), что соответствует температуре порядка 2 млн. градусов.
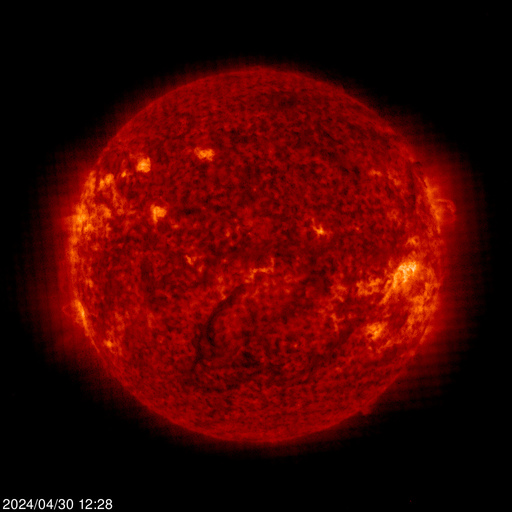
Солнце на длине волны 304 ангстрем (ультрафиолетовый диапазон), яркие пятна имеют температуру порядка 60-80 тыс. градусов.
На спутнике SOHO имеется спектрометрический коронограф, способный получать фотографии солнечной короны, блокируя свет, идущий непосредственно от светила, заслоняя его диском и создавая искусственное затмение в самом инструменте. Положение Солнечного диска отмечено белым кругом. Наиболее характерной особенностью короны являются корональные лучей — почти радиальные полосы, которые можно увидеть на снимках. Выброс корональной массы также можно увидеть с помощью коронографа.
Изображение солнечного ветра онлайн со спутника SOHO
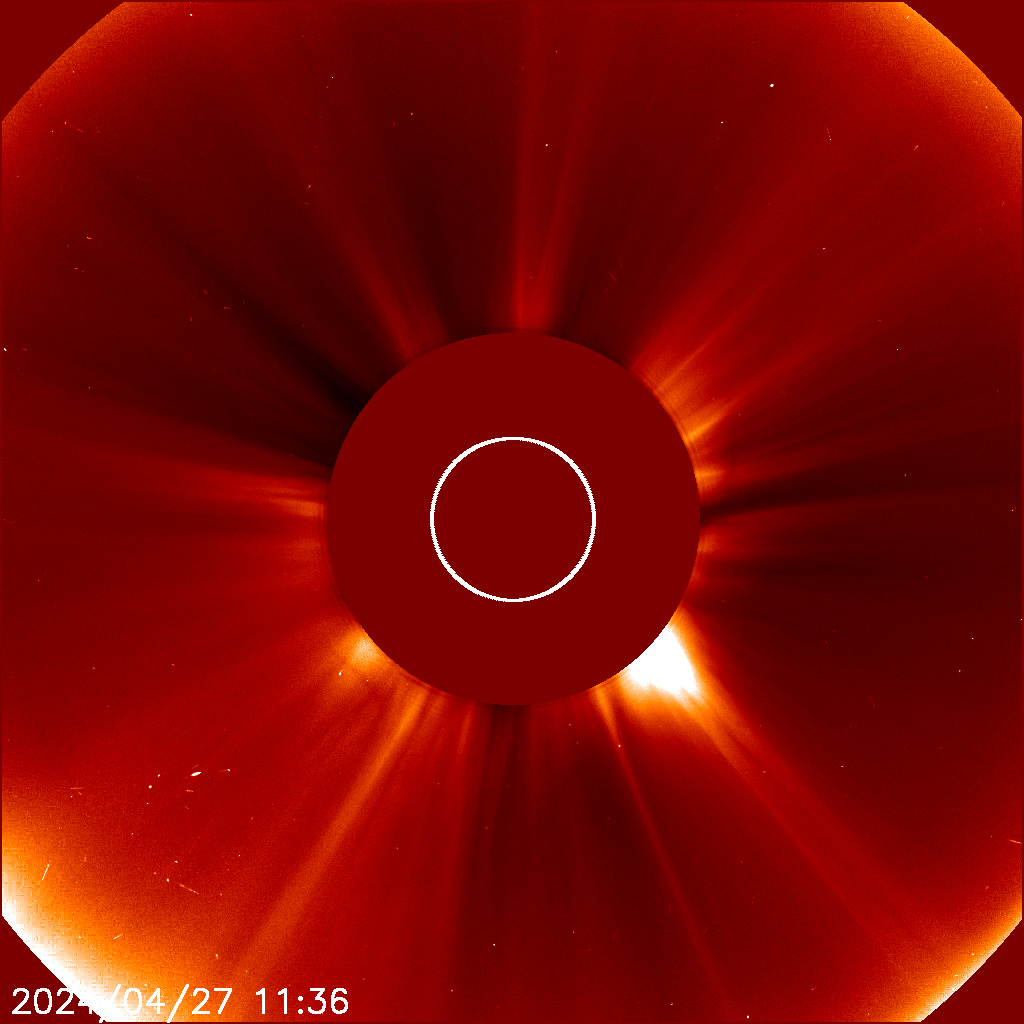
Солнечный ветер. Фотография охватывает около 8,5 миллионов километров
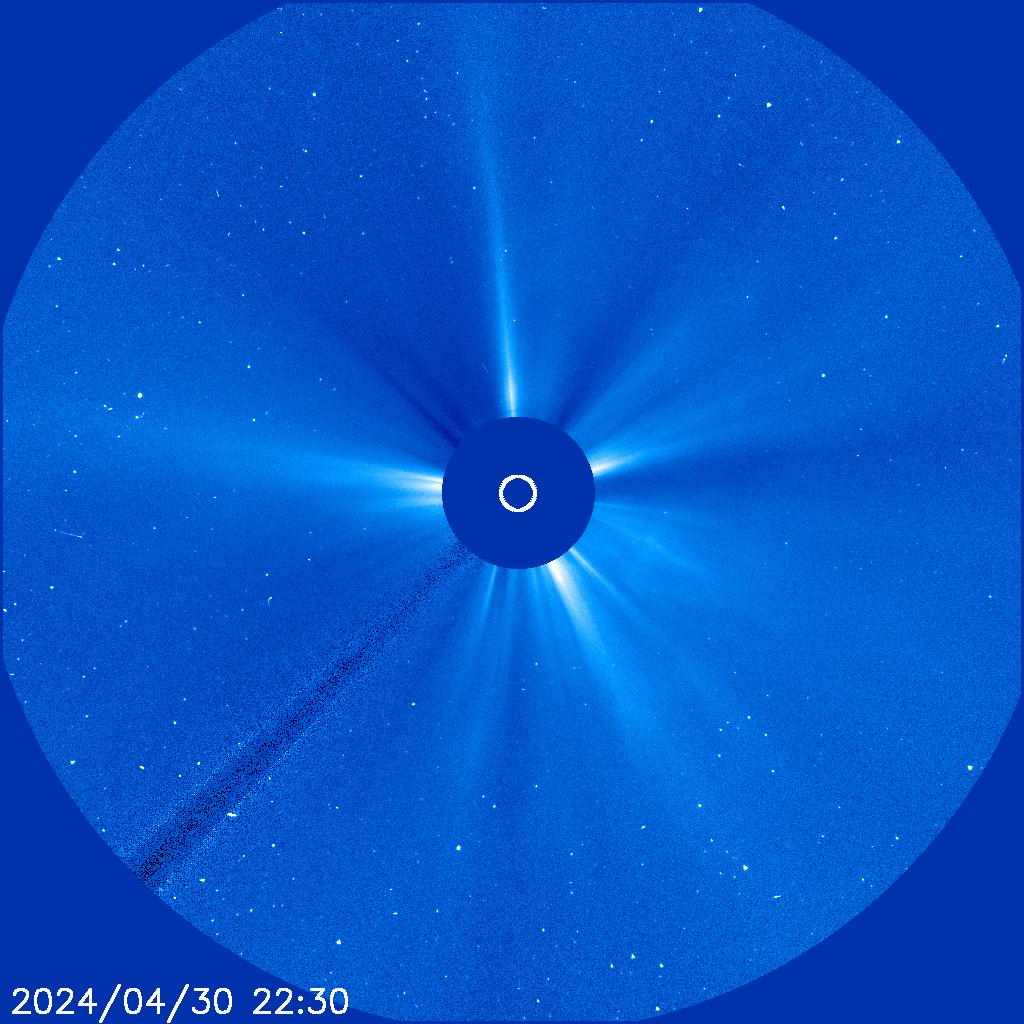
Изображение охватывает около 45 миллионов километров. Видны множество фоновых звезд
An inverse chronological list of ACE Real-Time Solar Wind Announcements
October, 2012 New Pointing for the ACE Satellite to Improve SWEPAM data
==================================================================
October 19, 2010 EPAM Energy Range Now Corrected on SWPC Website
Based on the advice of the ACE EPAM science team, the EPAM FP6p proton channel energy range shown in headers was corrected from 761-1220 keV to 795-1193 keV.
==================================================================
June 1, 2006 ACE RTSW SWEPAM Data Improvement
The ACE RTSW SWEPAM data processing was updated at 0000 UTC June 1, 2006. This change will result in improved solar wind parameters (speed, density, and temperature) that more closely match ACE Science Center data.
ACE RTSW MAG, EPAM, and SIS data are unaffected.
==================================================================
May 5, 2006 ACE RTSW SWEPAM Data Improvement
At 0000 UTC on June 1, 2006, the ACE RTSW SWEPAM data processing will be updated. This change will result in improved solar wind parameters (speed, density, and temperature) that more closely match ACE Science Center data. The most significant impact will be higher RTSW density values during low-speed, low-density solar wind conditions. ACE RTSW MAG, EPAM, and SIS data are unaffected.
==================================================================
May 15, 2006 ACE RTSW Data Timing Problem Resolved
From 1300UT May 12 to 1300 UT May 13 there was a problem in the SEC ACE RTSW data. Values were correct but the associated time tags were about 15 minutes earlier than the actual reading.
==================================================================
April 3, 2006 Termination of ACE Solar Wind Data
A comment period for the proposed NWS Termination of ACE Solar Wind Data was April 3 — May 18, 2006
==================================================================
May 19, 2005 SIS DATA noise
There is currently noise in the SIS RTSW proton rates. The SIS team is investigating the cause and expects it to be corrected
in the next few days.
==================================================================
August 24, 2004 ACE MAG Data Processing Change
ACE MAG data processing was updated at 0000 UTC on 24 August, 2004. This update should result in improved RTSW magnetic field values that
more closely match ACE Science Center data.
===========================================================================
February 4, 2004 EPAM Data Switched from LEMS30 to LEMS120
===========================================================================
November 12, 2003 EPAM Data Problems Continue
As a result of the last two weeks of high solar activity several of the RTSW EPAM proton channels have become abnormally high and have shown excessive noise. As a result the data from the 65-112 keV (P2), 112-187 keV (P3), and 310-50 keV (P5) energy channels have been removed from the real-time plots and lists. The 1060-1910 keV (P7) channel remains but has also begun to show noise. The 761-1220 (W1) proton channel and electron channels, being from another EPAM sensor, have been unaffected. SEC is investigating the switch to another EPAM proton sensor for its RTSW data stream.
===========================================================================
November 3, 2003 ACE EPAM Data Problems
========================================================================
March 18, 2001 ACE EPAM Data Processing Changed
ACE EPAM data processing was updated. The visible change was replacing the noisy Proton 47 to 65 keV data with the 65 to 112 keV data in EPAM lists and plots.
========================================================================
March 5, 2002 EPAM Data Processing Change
On March 18, 2002 EPAM data processing will be updated. On data lists, the header line changes to show the new energy range for the first Proton channel. On data plots, the legend changes.
EPAM data processing update:
In late November and early December 2001 the P1 channel (47 to 65 keV) data increased during an energetic particle event (small radiation storm) and never returned to nominal levels. The channel became «noisy» and after monitoring for a few weeks the decision was made to replace the P1 channel with the P2 channel (65 to 112 keV) data, the next higher energy channel within the same detector on EPAM.
During the later part of December 2001 the P5 channel (310 to 580 keV) showed anomalous periods of increased particle flux. The instrument PI from JHU/APL determined that when the detector was pointed in the general direction of the sun, the sector pointed toward the sun showed large increases in particle flux. This is believed to be due to solar contamination and only happens during limited times between each set ofspacecraft maneuvers. The decision was to change the processing of all channels from this detector to eliminate the solar noise problem. A third problem was induced by the solar noise problem: Whenever the P5 channel became noisy the P1 and P3 data would drop out. The cause of the drop out was a programming filter designed to eliminate «bad» data. Since not all of the data were «bad», only the sunward directed sector, a decision was made to eliminate all data from the sunward sector. Problems two and three were solved by the removal of the data from the sunward sectors for all channels. The only impact from removing the sunward sector data is larger fluctuations in the data when the flux is near background levels.
========================================================================
January 25, 2002 EPAM P1 Channel Data Update
EPAM lowest energy channel (P1) 47-65 keV data are suspect since late November. This channel will be replaced by late February. Possible cures are being investigated by the instrument team and SEC.
========================================================================
December 20, 2001 ACE EPAM P1 Channel Data Suspect
July 26, 2000 ACE EPAM Data Lists Header Line Changes
The ACE EPAM 5-min data lists, had incorrect Differential Proton Flux ranges. The header lines were changed beginning 26 July 2000.
CORRECTED:
# — Differential Flux —————————
# UT Date Time —————— Protons keV —————-
# YR MO DA HHMM 47-65 112-187 310-580 761-1220 1060-1910
INCORRECT:
# — Differential Flux —————————
# UT Date Time —————— Protons keV —————-
# YR MO DA HHMM 56-78 130-214 337-594 761-1220 1073-1802
==================================================================
July 30, 1998 ACE Hourly Averaged data
SEC creates monthly files of hourly averaged data from each of the ACE instruments. The files are updated every 3 hours beginning at 0010UT. The current month’s files are recreated at each run. The previous month’s files is created for the last time on the first day of the new month.
========================================================================
July 28, 1998 EPAM Algorithm Updated
The EPAM 761-1220 MeV Proton algorithm was adjusted at 7/28 1600UT. There was factor of 3 decrease which matches expected values.
April 3, 1998 Update on Quality of ACE RTSW Data Sets
MAG: All data nominal
SWEPAM: All data nominal. When the velocity of the solar wind falls to low values the current algorithm will often set a flag indicating a problem exists. SEC flags the data in the data base and does not plot the data on the web site. The end result is a number of missing data at the one minute cadence.
EPAM: All differential flux channels nominal, except for W1. This channel is impacted by above normal temperatures on ACE. APL is looking at this issue. The only impact is the anisotropy index is not valid. The energy range of this channel is covered by the other existing channels.
SIS: Both integral channels nominal. Integral flux is at background until a large event is detected
Update on tracking:
RAL, NASA, and AFSCN are fully operational. CRL is down for antenna repair and is expected up in two months. AFSCN has added extra tracking coverage during the time period normally covered by CRL. Occasionally short dropouts occur during a tracking pass, usually due to data transmission problems. Bad data records are received during some tracking passes. Software eliminates most of the problem data, but not all problem data.
2/9/98 — A software solution to the SWEPAM instrument problem was installed on Feb 5. Density, Bulk Speed and Ion Temperature data now appear nominal.
2/2/98 — The Spacecraft Location files will not be available until March.
2/2/98 — The Magnetometer data is still in spacecraft coordinates (RTN). Will not be switched to GSM coordinates in March.
2/2/98 — Lists of hourly average will not be available until March.
2/2/98 — The limits shown below for Mag component magnitude, SWEPAM bulk speed, SWEPAM X vector velocity, and Xgse location were corrected 2/2/98.
1/21/98 — Operational ACE data lists began running.
Инструменты SOHO
Один из основных инструментов спутника — это EIT, расшифровывается как Extreme ultraviolet Imaging Telescope (ультрафиолетовый телескоп).
Он показывает снимки атмосферы нашей звезды сделанные на длине волны 171, 195, 284 и 304 ангстрем. Яркие области на фотографии, сделанные на длине волны 304 имеют температуру от 60 000 до 80 000 градусов по Кельвину. 171 — соответствует температурам 1 млн. градусов, на 195 — яркие области имеют температуру 1,5 млн. градусов, и наконец, 284 — соответствует температуре 2 млн. градусов Кельвина.
Также на SOHO установлен прибор MDI (Michelson Doppler Imager-измеритель доплеровского смещения). Он позволяет снимать на длине волны 6768 ангстрем, на этой длине волны очень хорошо наблюдать Солнечные пятна.
Также прибор MDI делает магнитограммы, показывающие магнитное поле в солнечной фотосфере. Черные и белые области указывают противоположную полярность.
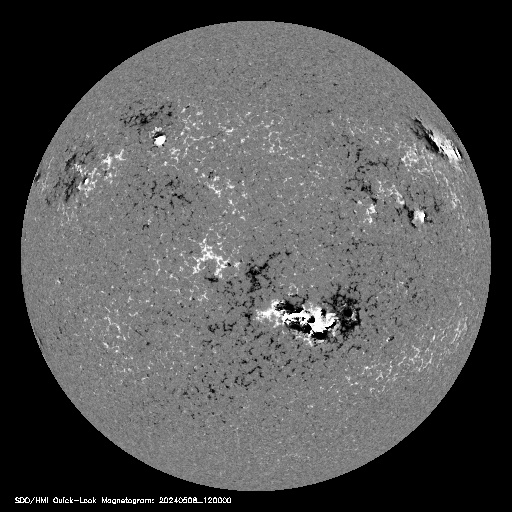
Изображения, показанные здесь получены вблизи 6768 ангстрем спутником «коллегой» SDO. Наиболее характерными особенностями на фотографии являются пятна.
Солнечная активность сегодня
Данные представленные ниже получены инструментом AIA установленном на космическом аппарате Solar Dynamics Observatory (SDO) и предназначены для получения качественных изображений короны. Снимки охватывают как минимум 1,3 солнечных диаметров в нескольких длинах волн, с разрешением около 1 угловой секунде.
Основная цель инструмента AIA — значительно улучшить наше понимание физики Солнечной атмосферы, которая формирует космическую погоду. Инструмент AIA производит данные, необходимые для количественного изучения корональных магнитных полей и плазмы. Он обеспечивает новое понимание наблюдаемых процессов и, в конечном счете, развивает передовые инструменты прогнозирования, необходимые для всех нас
Ниже приведены снимки активности Солнца сегодня онлайн в режиме реального времени
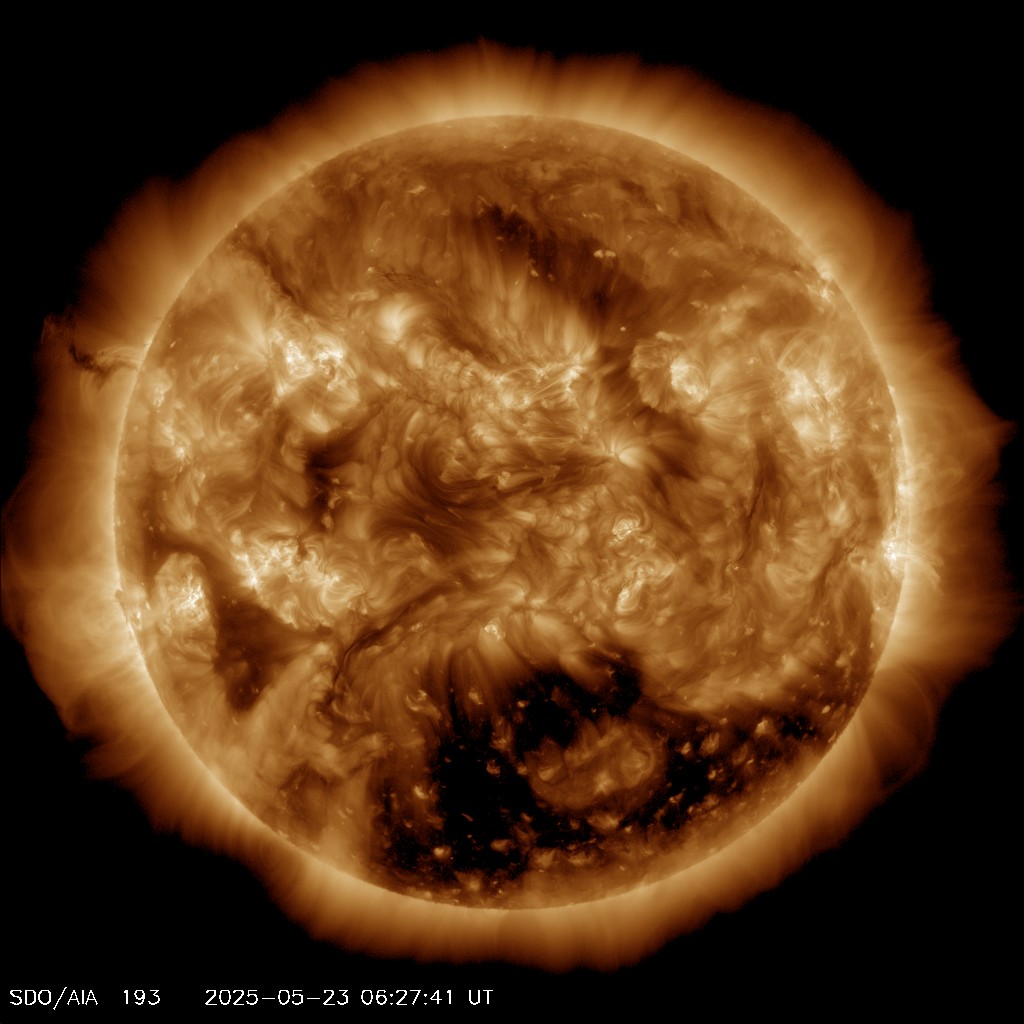
Длина волны 193 ангстрем (охватывает корону), что соответствует температуре порядка 1,2 млн. градусов.
Состояние космической погоды в Солнечной системе зависит от нашего светила. Потоки ионизированной плазмы, жесткое излучение и вспышки, солнечный ветер, это главные параметры.
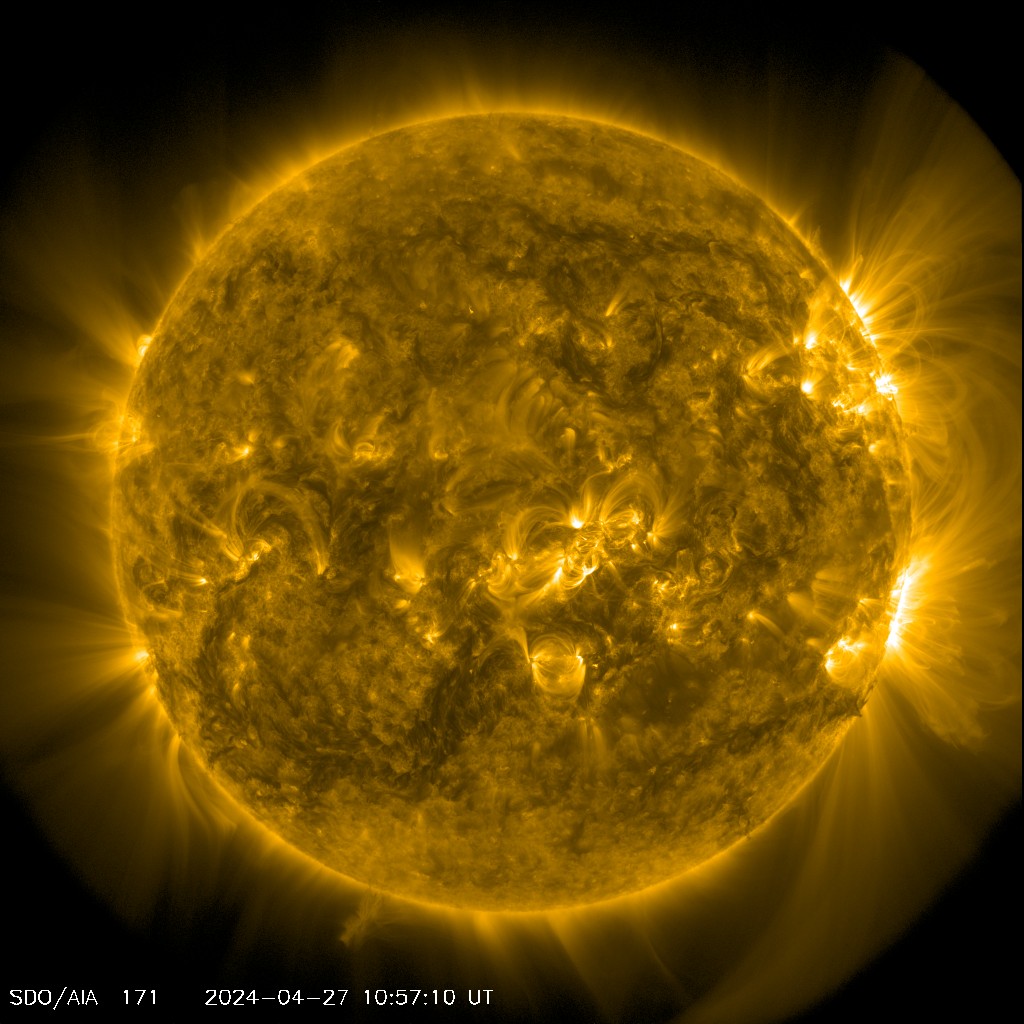
Длина волны 171 ангстрем (охватывает спокойную корону), что соответствует температуре порядка 0,6 млн. градусов.
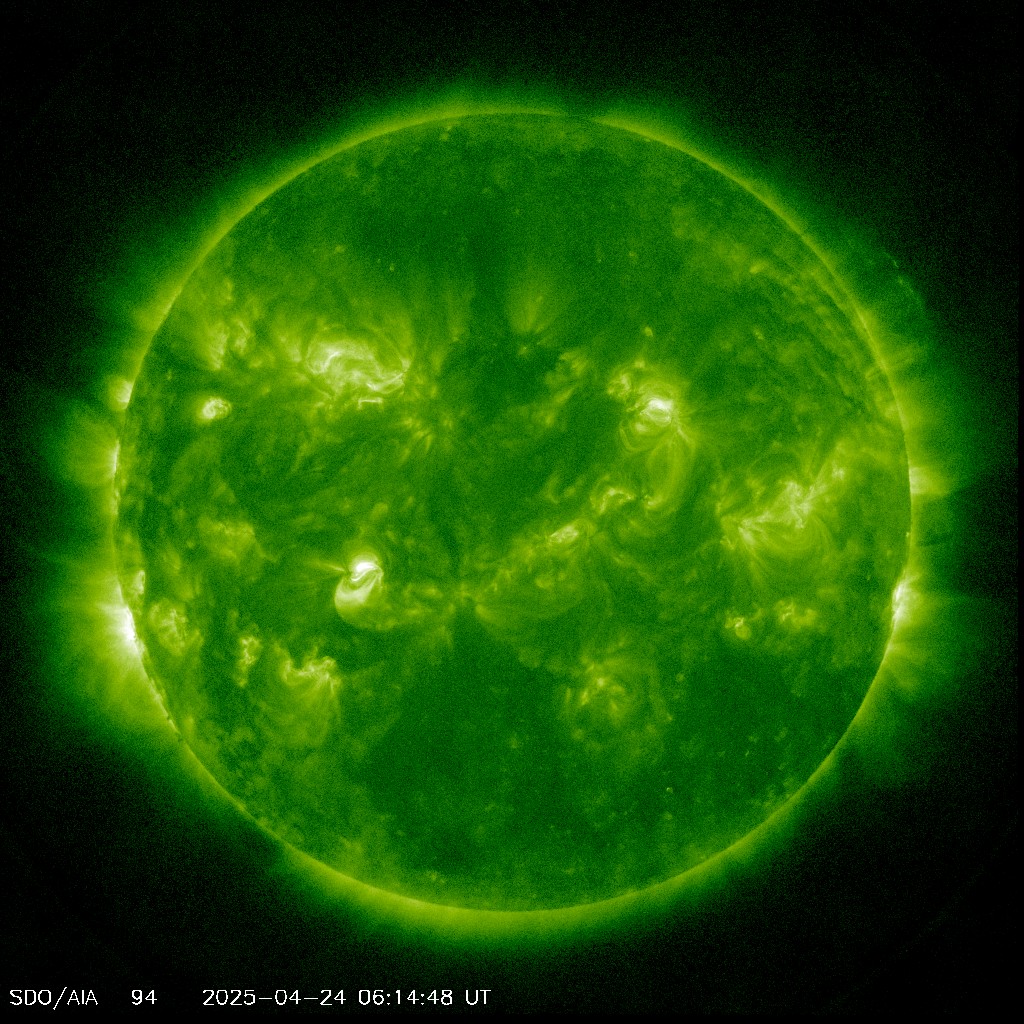
Длина волны 94 ангстрем (горячая корона), что соответствует температуре порядка 6,3 млн. градусов.
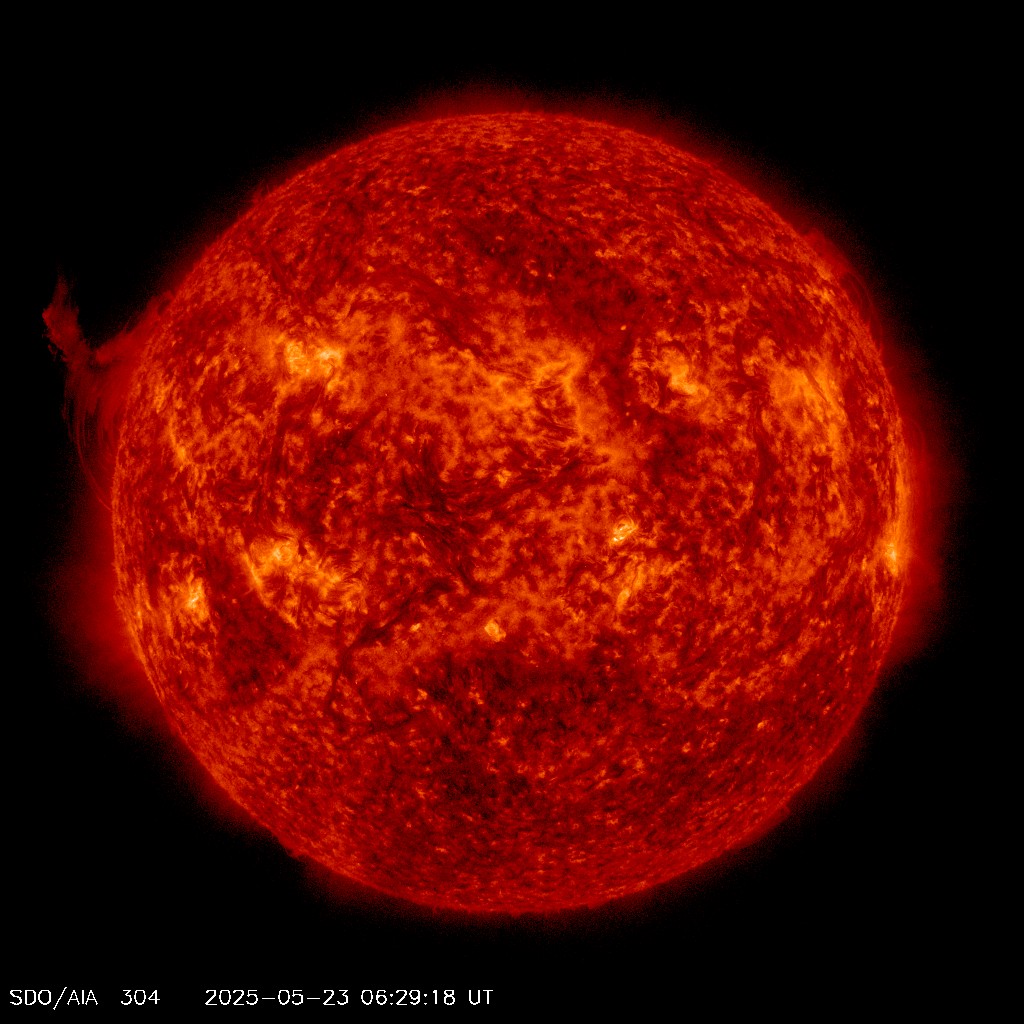
Длина волны 304 ангстрем (охватывает переходный слой и хромосферу), что соответствует температуре порядка 50 000 градусов.
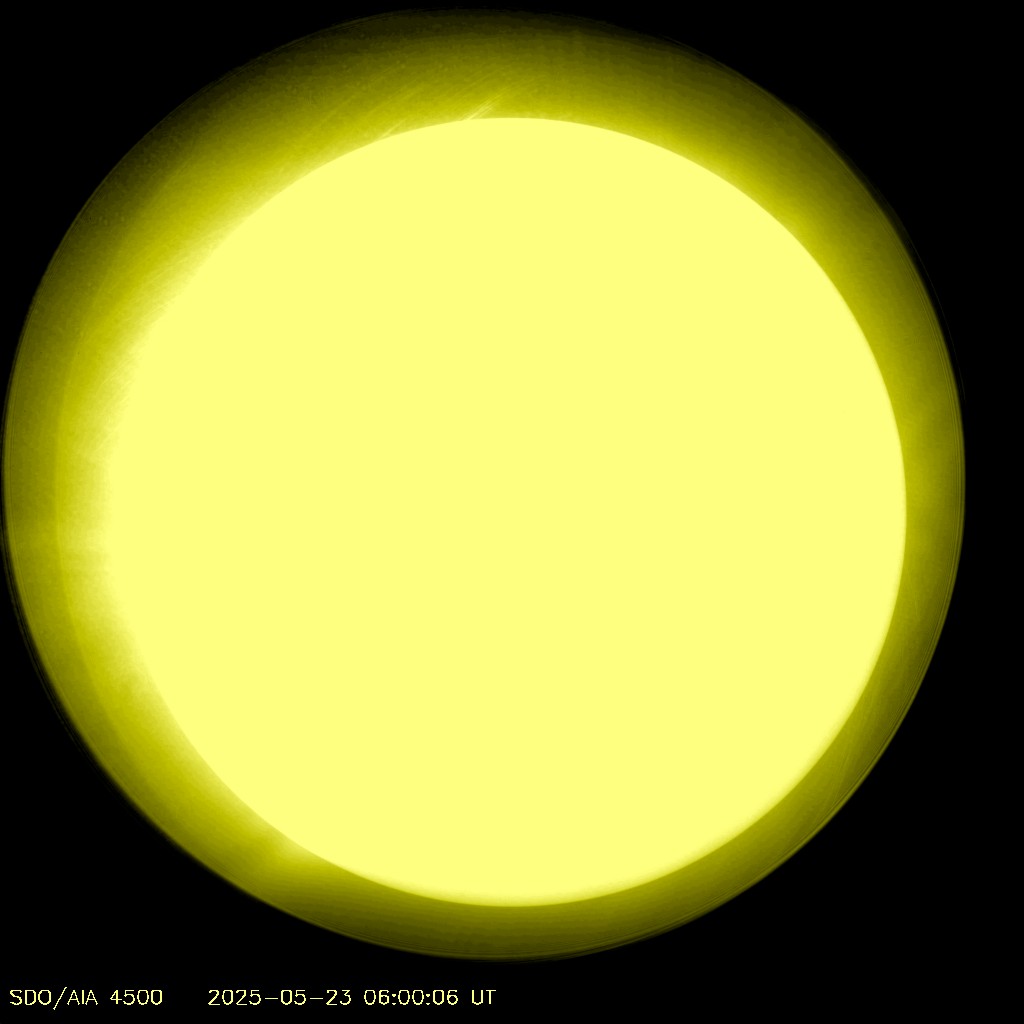
Длина волны 4500 ангстрем (фотосфера), что соответствует температуре порядка 5000 градусов.
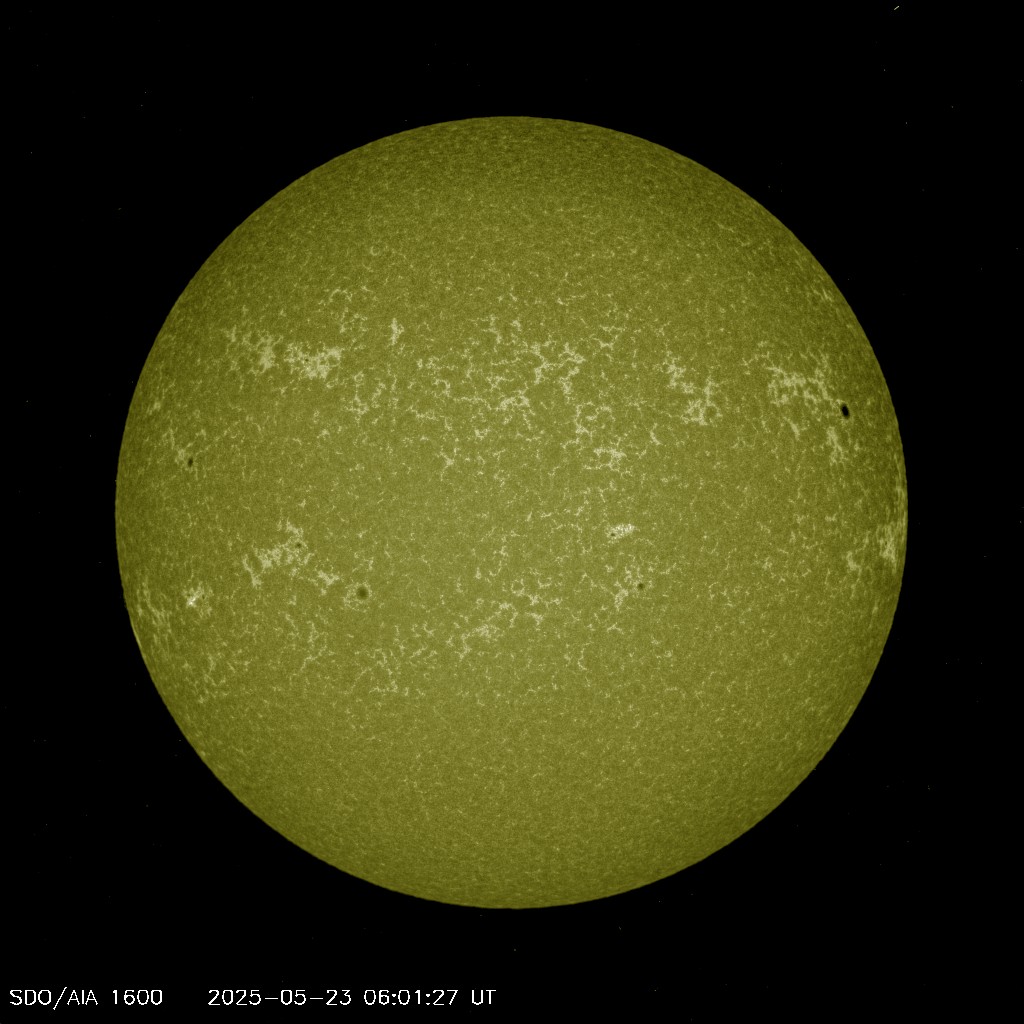
Длина волны 1600 ангстрем (переходный слой и верхняя фотосфера), что соответствует температуре порядка 5000 градусов.
NOAA Scales mini
Space Weather Conditions
24-Hour Observed Maximums
Current Space Weather Conditions
Weak or minor degradation of HF radio communication on sunlit side, occasional loss of radio contact.
Low-frequency navigation signals degraded for brief intervals.
More about the NOAA Space Weather Scales
Real-Time Solar Wind (RTSW) data refers to data from any spacecraft located upwind of Earth, typically orbiting the L1 Lagrange point, that is being tracked by the Real-Time Solar Wind Network of tracking stations. The NOAA/DSCOVR satellite became the operational RTSW spacecraft on July 27, 2016 at 1600UT (noon EDT, 10am MDT).
SWPC maintains the ability to instantaneously switch the spacecraft that provides the RTSW data. During times of outages in DSCOVR data or problems with the data, this page may instead display the data from the NASA/ACE spacecraft.
What’s New: There is a lot new here. Maybe the biggest one is, you can get access to all of the RTSW plasma and magnetometer since February 1998. As you zoom in to shorter time periods, the resolution of the data displayed will increase automatically. The highest resolution available can be 1 second magnetometer and 20 second thermal plasma data. You can view data from the operational spacecraft or choose between DSCOVR and ACE. You can also overlay model output from WSA-Enlil and/or GEOSPACE, as well as 27-day recurrence data. The geomagnetic K and A indices can also be plotted.
Tabs along the bottom of the plot allow different default plots to be chosen. These include data ranges of 2 hours up to ~20 years and displays with only Magnetometer, only Solar Wind Plasma, or a combination of both as well as other features described below.
Display of data values: When mousing over the data (or ‘tapping’ with a mobile device), data values are displayed within the graph.
Zoom: Zoom by click and holding on the start (end) of the interval and then moving the mouse to the end (start) of the interval before releasing the mouse click (on mobile devices use ‘pinch-zoom’). This defines the zoom area. The thin bar at the bottom shows the zoom area relative to the full range of data. Double click (tap) zooms out to the default interval. Holding down the shift key while double-clicking steps out the time range by a factor of two.
Menus/Buttons (in a row below the data plots)
Selects the display default duration. All plots automatically update adding new data on the right and dropping data on the left as it ages off.
• Save as text: Will download an ascii text file (named rtsw_plot_data_YYYY-MM-DDThh_mm_ss.txt) containing the data shown in the current display.
• Save as Image: Will download a .PNG image (named plot_image.png) of the current display. The data values displayed will default to the most recently available data.
An inverse chronological list of Real-Time Solar Wind Announcements
The Faraday Cup Data Processing Unit (IDPU) experienced two recent interrupts that resulted in data outages. These were the first times this occurred in the life of the mission.
==================================================================
October 10, 2017: Safe Hold #14
DSCOVR had its 14th safe hold event today. All of the safehold events so far are listed below.
Safehold # / Date
————————
1 / Jun 23, 2015
2 / Jun 28, 2015
3 / Jul 15, 2015
4 / Aug 04, 2015
5 / Sep 29, 2015
6 / Oct 08, 2015
7 / Jan 06, 2016
8 / Jan 14, 2016
9 / May 24, 2016
10 / Sep 17, 2016
11 / Oct 11, 2016
12 / Oct 30, 2016
13 / Aug 24, 2017
14 / Oct 10, 2017
Changes were made to the Faraday Cup flight software to alter the behavior of the instrument. Essentially, the instrument now waits longer between scans to reduce the impact of spurious noise that was causing the instrument to lose the solar wind proton peak. This change may not eliminate the loss of peak tracking issue completely, but it is a significant step in the right direction.
A change was made to the Faraday Cup processing to remove some of the noise that was resulting in higher than expected densities and temperature. The change ignores high energy noise that was resulting in wider than expected velocity distributions.
Real-time Solar Wind and Magnetometer data is now available in JSON format for up to the past 7 days from the SWPC Data Service. These JSON files will automatically include the data from the active RTSW spacecraft. By default, that has been DSCOVR since July 27 at 1600 UT.
A complete DSCOVR data archive is available at the NOAA National Center for Environmental Information.
Онлайн график активности космической погоды
Содержит следующие параметры: график протонов (данные со спутника GOES-14). Обновление каждые 5 минут.